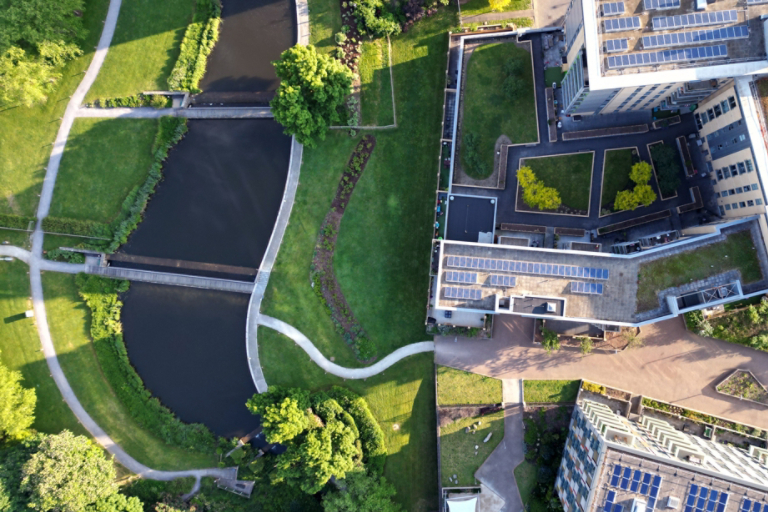
Greenhouse Gas Emissions, Pollutant Emissions and Refrigerants
Our 2030 Sustainability Commitment is to achieve carbon neutrality and reduce our customers’ carbon footprint by one gigaton (or 1 billion metric tons of CO2e) by 2030.
This builds on our previous commitment to reduce Scope 1 and 2 emissions (on a per unit revenue basis) 35% by 2020 compared to a 2013 baseline. We met and exceeded this goal in 2018, having reduced the absolute greenhouse gas (GHG) emissions associated with our operations by more than 195,225 metric tons of CO2e — or 36% — since 2013. In addition, total energy efficiency has improved by 27%.
In total, we avoided 1,073,507 metric tons of CO2e in operational GHG emissions since 2013.
To achieve our goals, we account for operational, product and fuel-related emissions. We design programs, products and initiatives that enable us to reduce emissions and achieve our targets. A third party assures our GHG emissions data from our operations every year, and we performed an internal audit in 2017 to ensure the integrity of our process for collecting product GHG emissions data.
Approximately 36% of our operational Scope 1 and 2 GHG emissions are from electricity use. Refrigerants, an essential component of many of our products, are also a significant source of emissions. These compounds, also called hydrofluorocarbons (HFCs), have higher global warming potential than carbon dioxide and account for approximately 39% of our Scope 1 and 2 emissions. Through refrigerant management and transition over the last six years, we achieved a 50% reduction in operational emissions intensity. Read about how we manage energy. We have also aligned our public policy advocacy with our ambitions to phase out HFCs and increase energy efficiency.
Approach
We are becoming more efficient in our operations to optimize our energy use and increase business productivity. Some of our energy efficiency initiatives include optimizing HVAC systems, employee Green Team programs, eliminating leakage in compressed air systems and re-lamping.
We have also started implementing a multifaceted strategy to achieve carbon neutral operations by 2030. Our focus areas include:
- Phasing out of refrigerants with high global warming potential
- Finding ways to reduce our energy use to meet the 10% reduction target
- Investing in renewable energy to meet our 100% target
- Completing electrification and route optimization of our Service Teams fleets
- Revamping our manufacturing systems to be less energy intensive through product design for manufacturing
We will purchase carbon credits to obtain any remaining GHG emission reductions.
GHG Emissions* (units: metric tons CO2e) | 2019 | 2018 | 2017 | 2016 | 2015 | 2014 | 2013 | |
---|---|---|---|---|---|---|---|---|
Direct CO2e (GHG Scope 1) | 343,125 | 368,797 | 390,827 | 411,655 | 481,061 | 485,386 | 543,601 | |
Breakdown of Scope 1 emissions | Emissions from fuel | 136,098 | 131,811 | 130,528 | 131,729 | 133,917 | 131,376 | 138,123 |
Emissions from refrigerants | 212,278 | 236,986 | 260,299 | 279,926 | 347,144 | 354,010 | 405,478 | |
Indirect CO2e (GHG Scope 2) (emissions from electricity) | 194,437 | 197,783 | 188,060 | 206,211 | 228,416 | 233,583 | 257,602 | |
Total (Scope 1 and 2 emissions) | 537,562 | 566,580 | 578,887 | 617,866 | 709,476 | 718,969 | 801,203 | |
Normalized GHG emissions (metric tons/USD) | 32.65 | 36.16 | 40.77 | 45.74 | 53.34 | 55.77 | 64.87 | |
Reduction of absolute GHG emissions (ton CO2e compared to 2013 baseline) | 177,034 | |||||||
Reduction of GHG emissions intensity (2013 baseline) | 50% |
Scope 3 GHG Emissions
Driving down emissions that occur in our value chain is one of our biggest sustainability challenges and opportunities. That’s why we were one of the first companies to set a goal related to the emissions of our products — a goal that was also approved by the Science Based Targets Initiative.
2019 Material Scope 3 Emissions (units: metric tons CO2e) | |
---|---|
Product use | 238,000,000 |
Business travel (assured) | 30,340 |
Upstream leased assets (estimate) | 67,000 |
Upstream and downstream distribution and transportation (estimate) | 135,628 |
Other Scope 3 emissions categories, such as waste generated in operations, are not material to our business. Read more in our annual CDP Climate Change questionnaire.
HFC Alternatives
To reduce product-related GHG emissions, we are identifying HFC alternatives and offering our customers more sustainable products. We believe we can speed up the transition to products that have a smaller environmental impact without compromising product quality.
Over the last six years, we have avoided more than 20 million metric tons of CO2e globally from our products, equal to the GHG emissions from the energy used in 8.4 million homes for one year. By 2030, our goal is to reduce our products’ carbon footprint by 50 million metric tons, which is equal to the energy used in 5.9 million homes for one year. We have also invested more than $500 million in product-related research and development to fund the long-term reduction of GHG emissions.
Read more about our 2030 Sustainability Commitments and approach to energy-efficient and low emissions products and public policy advocacy.
Fuel-Related Emissions
In 2019, we increased the fuel efficiency of our fleet by 5%, and saved approximately 3,300 metric tons of CO2e, which is equivalent to the energy used in 1,396 homes for one year.
Through the process of converting to a hybrid fleet, our fleet fuel
efficiency improved from 15.89 to 16.73 miles per gallon in 2019. We
also use new vehicles that have better fuel economy and engine
performance compared to large displacement vehicles.
Ecowise™ Portfolio
Our EcoWise portfolio reduces the GHG emissions footprint of our refrigerant-bearing products and offers our customers more sustainable choices. EcoWise products are specifically designed for next-generation, low global warming potential (GWP) refrigerants without sacrificing energy efficiency, safety and operating performance.
NOx and SOx Emissions* (units: metric tons) | 2019 | 2018 | 2017 | 2016 | 2015 | 2014 | 2013 |
---|---|---|---|---|---|---|---|
NOx | 121.47 | 117.25 | 115.90 | 116.86 | 117.23 | 114.68 | 116.41 |
SOx | 7.56 | 7.79 | 7.52 | 7.04 | 7.21 | 6.24 | 7.52 |
Volatile Organic Compound (VOC) Air Emissions* (units: metric tons) |
2019 | 2018 | 2017 | 2016 | 2015 | 2014 | 2013 |
---|---|---|---|---|---|---|---|
Direct VOX emissions | 301.74 | 284.66 | 289.24 | 289.23 | 285.93 | 258.63 | 313.16 |
Refrigerants Data* | 2019 | 2018 | 2017 | 2016 | 2015 | 2014 | 2013 |
---|---|---|---|---|---|---|---|
Refrigerant emissions (Refrigerant losses in pounds of refrigerant) |
293,246 | 324,678 | 364,219 | 373,229 | 437,492 | 425,414 | 495,059 |
Normalized GHG emissions (metric tons CO2e/million USD) |
12.79 | 15.13 | 18.33 | 20.72 | 26.10 | 27.46 | 32.83 |
*Slight adjustments made to previously reported data for 2013–2018 to reflect changes in our operational footprint.
Bold Commitments. Tangible Progress.
Reducing GHGs with Refrigerants Management
Small changes add up to big impacts. This year, we made some changes to our refrigerants management that helped to reduced GHG emissions and decrease manufacturing costs from losing refrigerants to the environment. The changes included updating our technical procedures/standard work to define key equipment specifications and outlining administrative control measures. The updates help reduce routine leaks and accidental losses for our facilities that charge and recover refrigerants during manufacturing.