English
As our customers’ demand for low-carbon solutions increases – and the need to address climate change intensifies – our global business evolves to meet these challenges.
We use our expertise in energy-efficiency, electrification of heating and cooling and building management systems to reduce the environmental impacts of our own business, while also improving operational efficiency. We deliver these same decarbonization solutions, strategies and technology to our customers, helping them and our industry move closer to a net-zero future.
Environmental Highlights
44%
reduction in Scope 1 and 2 absolute emissions from our 2019 baseline toward our science-based target of 50% reduction by 2030
49%
reduction in total water use since 2019
68%
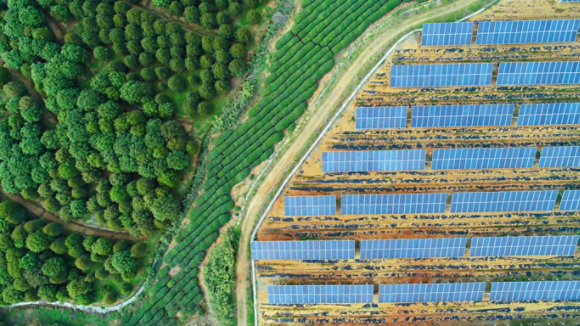
of our electricity consumption came from renewable sources in 2024
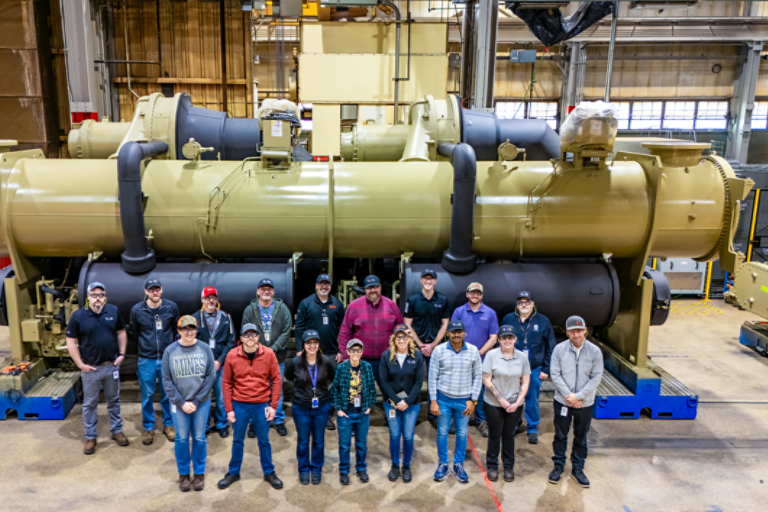
Leading by Example in La Crosse
Our La Crosse facility in Wisconsin is a holistic model of environmental and social sustainability – with significant reductions achieved in overall energy use, carbon emissions, water and waste – and investments in renewable energy, talent development and the local community.